
[vSAN] Tips and Tricks for vSAN troubleshooting
Today I attended a Web-Session from VMware with the topic vSAN troubleshooting tips and tricks and I wanted to share those tips and tricks with you.
Common sense
Ensure that your hardware is on the VMware HCL
– Disks / Controllers / Firmare / Drivers
Ensure that you have up-to-date backups (and test the restore process fully)
vSAN Overview
Cluster: 2-64 physical hosts
Host: 1-5 disk groups
Disk Group: 1 flash for cache, 1-7 flash or HDD devices for capacity
vSAN Objects:
– VM Home, VM Swap, VMDK, Delta Disk, Memory Delta
Storage Policies:
– Applied at per VM level or VMDK level
– Define protection level & performance
Each object is made up of one or more components (depending on your storage policy)

Component states:
- Active – component accessible
- Absent – Inaccessible, but no explicit error codes sensed
- host outage or maint mode with “ensure accessibility”
- rebuild begins after 60 minute timeout
- Degraded – Inaccessible with error codes sensed
- device failure
- rebuild begins immediately
- Active – stale
- In queue of objects to rebuild
vSAN Tools
- vRealize Ops / Log Insight
- ESXCLI
- RVC
- Health Check
- vSAN Observer (for performance issues)
ESXCLI
esxcli vsan – gives the available namespaces
New in 6.6: debug & health
esxcli vsan helath cluster list – Gives you an overview with the traffic light system (green, yellow, red) where you see all tests
esxcli vsan health cluster get -t “vSAN Disk Balance” – get results of a test from above command
esxcli vsan health cluster get -t “vSAN object health” – vSAN object health could mean serious problems if status is red. (Get UUID of object to track the problem with those objects)
esxcli vsan debug – gives available namespaces
esxcli vsan debug resync summary – give information of current resync process
esxcli vsan debug object health summary get – gives you an overview of your health
esxcli vsan debug object list |more – Gives back all objects back including component states
esxcli vsan debug disk list – gives you information about your disk and if they can keep up
esxcli vsan debug controller list – gives information about your disk controllers (HCL information, Queue depth)
RVC (Ruby vSphere Console)
The RVC is preinstalled on all vCenter Server variants.
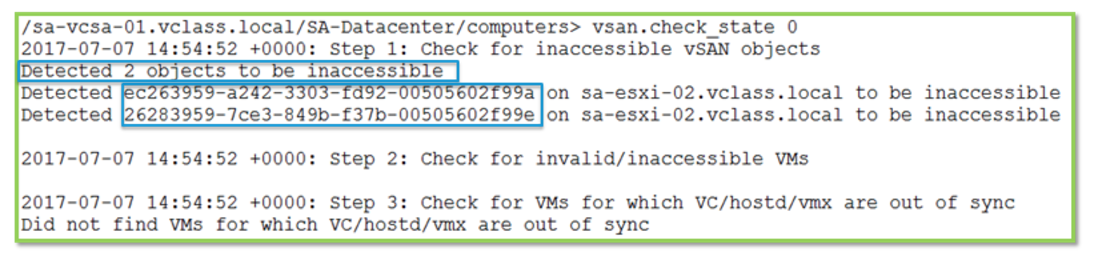
vsan.check_state 0
vsan.disks_stats 0

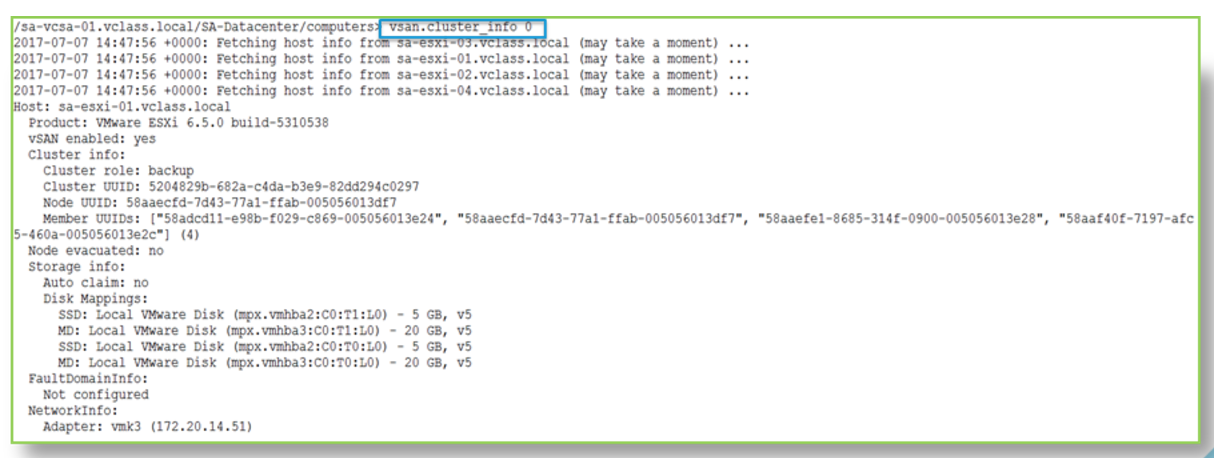
vsan.cluster_info 0
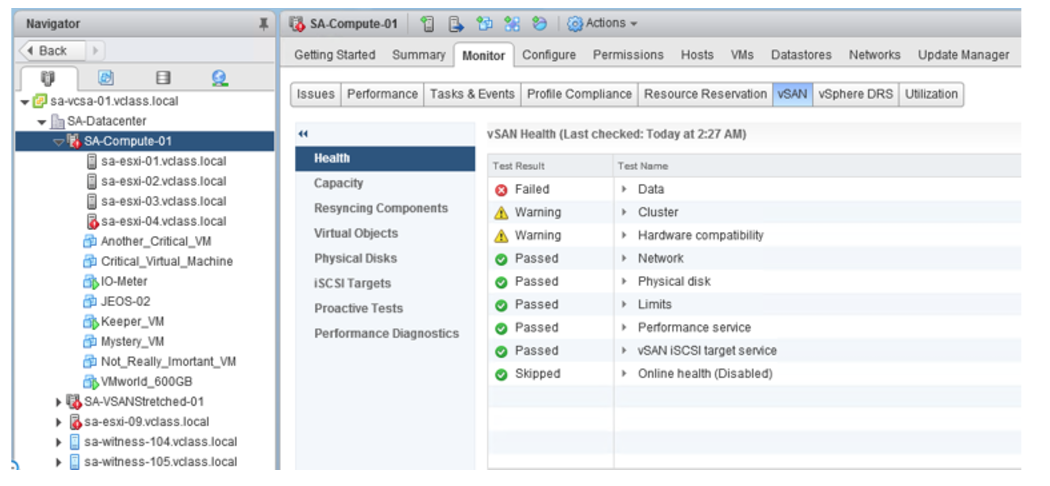
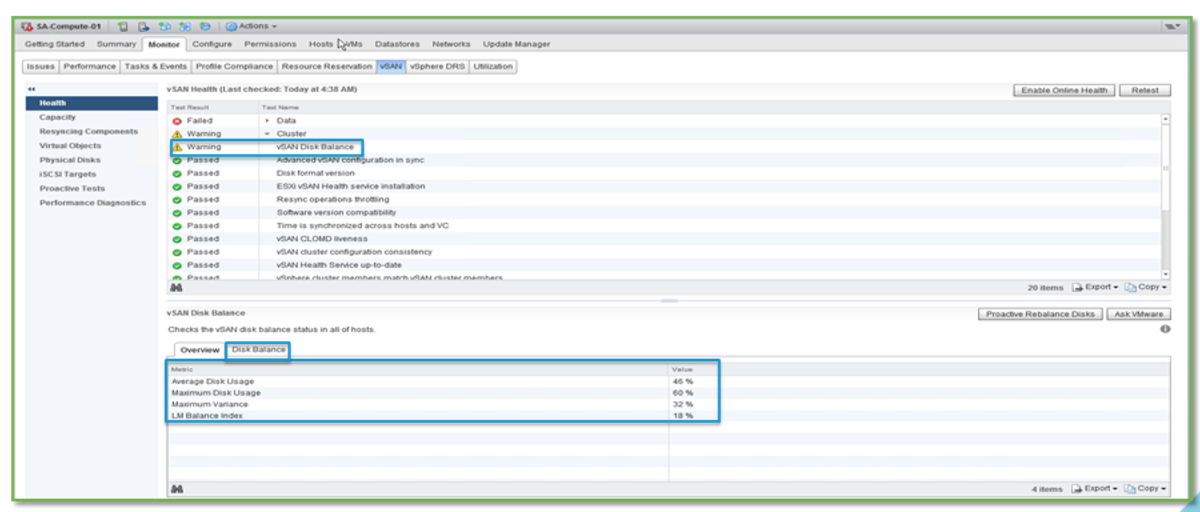
Health UI
vSAN Disk balance
vSAN Health
python /usr/lib/vmware-vpx/vsan-health/vsan-vc-health-status.py > /tmp/vsan_status.txt

Running this on a individual node:
Location: /usr/lib/vmware/vsan/bin/vsan-health-status.pyc
python /usr/lib/vmware/vsan/bin/vsan-health-status.pyc
KB 2107705 has more information on that.
When to use those: Health Service on vCenter not available
Use Cases
Cluster with 6 hosts. Three nodes were added. No capacity added after adding the hosts.
esxcli vsan storage list
 In CMMDS: false – take note of the naa… ID
- Check vobd.log (search for naa… ID)
- Check boot.gz (use zcat; search for naa… ID)
- Disk naa… ID detected to be a snapshot
Resolution:
– Disk cannot be added because it already has a filesystem on it
– Disk was given UUID, it was in a cluster and used at some point
– Verified to delete data
– Used partedutil to kill partitions
– Delete disk groups and recreate disk groups
Useful Logs:
vobd.log
Search for “problem” and “permanent”


Leave a Reply